Grundlæggende statistik
| Institutionelle ejere | 62 total, 59 long only, 0 short only, 3 long/short - change of 22,47% MRQ |
| Gennemsnitlig porteføljeallokering | 0.4501 % - change of 58,87% MRQ |
| Institutionelle aktier (lange) | 19.893.833 (ex 13D/G) - change of 14,55MM shares 20,81% MRQ |
| Institutionel værdi (lang) | $ 43.477 USD ($1000) |
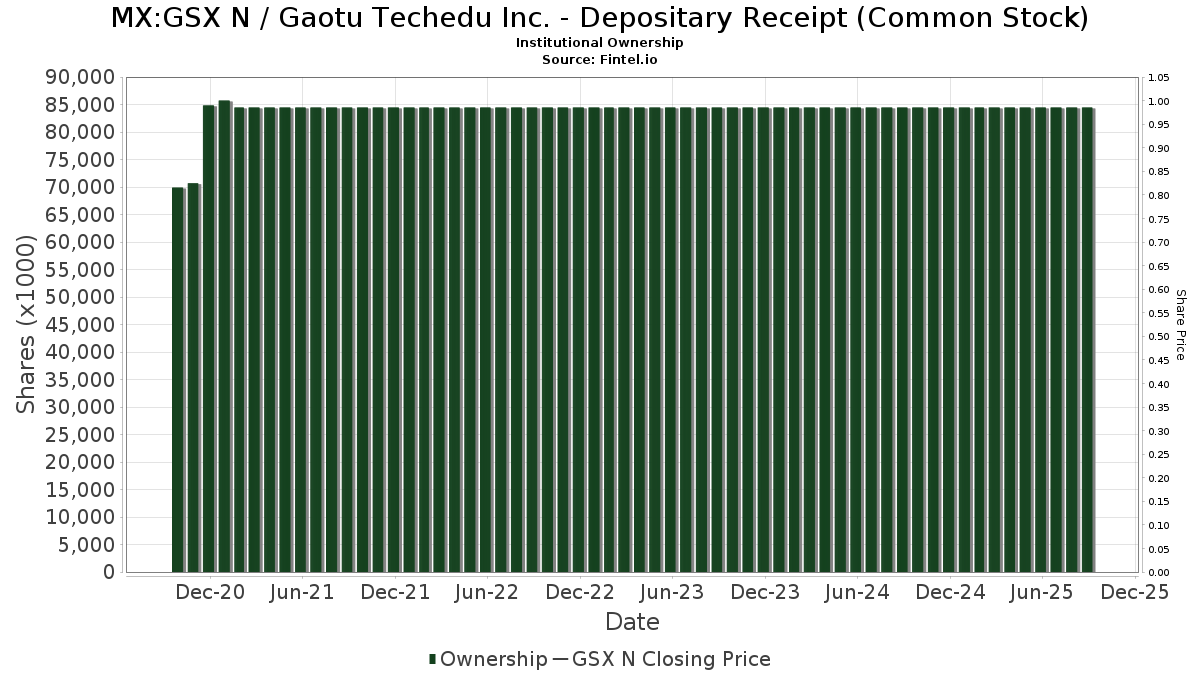
Institutionelt ejerskab og aktionærer
Gaotu Techedu Inc. - Depositary Receipt (Common Stock) (MX:GSX N) har 62 institutionelle ejere og aktionærer, der har indsendt 13D/G- eller 13F-formularer til Securities Exchange Commission (SEC). Disse institutioner har i alt 19,893,833 aktier. Største aktionærer omfatter Vanguard Group Inc, Renaissance Technologies Llc, Morgan Stanley, Acadian Asset Management Llc, Goldman Sachs Group Inc, Citadel Advisors Llc, D. E. Shaw & Co., Inc., BlackRock, Inc., Connor, Clark & Lunn Investment Management Ltd., and Arrowstreet Capital, Limited Partnership .
Gaotu Techedu Inc. - Depositary Receipt (Common Stock) (BMV:GSX N) institutionel ejerskabsstruktur viser aktuelle positioner i virksomheden efter institutioner og fonde, samt seneste ændringer i positionsstørrelse. Større aktionærer kan omfatte individuelle investorer, investeringsforeninger, hedgefonde eller institutioner. Skema 13D angiver, at investoren besidder (eller besidder) mere end 5 % af virksomheden og har til hensigt (eller har til hensigt at) aktivt at forfølge en ændring i forretningsstrategi. Skema 13G indikerer en passiv investering på over 5%.
Fondens stemningsscore
Fund Sentiment Score (fka Ownership Accumulation Score) finder de aktier, der bliver mest købt af fonde. Det er resultatet af en sofistikeret, multi-faktor kvantitativ model, der identificerer virksomheder med de højeste niveauer af institutionel akkumulering. Scoringsmodellen bruger en kombination af den samlede stigning i oplyste ejere, ændringerne i porteføljeallokeringer i disse ejere og andre målinger. Tallet går fra 0 til 100, hvor højere tal indikerer et højere niveau af akkumulering for sine jævnaldrende, og 50 er gennemsnittet.
Opdateringsfrekvens: Dagligt
Se Ownership Explorer, som giver en liste over højest rangerende virksomheder.
AI+ Ask Fintel’s AI assistant about Gaotu Techedu Inc. - Depositary Receipt (Common Stock).
Select a question to share a public post with an AI-crafted answer.
Thinking of good questions…
13F og NPORT arkivering
Detaljer om 13F-arkivering er gratis. Detaljer om NP-ansøgninger kræver et premium-medlemskab. Grønne rækker angiver nye positioner. Røde rækker angiver lukkede positioner. Klik på linket ikon for at se den fulde transaktionshistorik.
Opgrader
for at låse premium-data op og eksportere til Excel ![]() .
.
| Fil dato | Kilde | Investor | Type | Gennemsnitlig pris (Øst) |
Aktier | Δ Aktier (%) |
Rapporteret Værdi ($1000) |
Δ Værdi (%) |
Port Alloc (%) |
|
|---|---|---|---|---|---|---|---|---|---|---|
| 2025-11-07 | 13F | Pnc Financial Services Group, Inc. | 0 | -100,00 | 0 | |||||
| 2026-02-17 | 13F | Numerai GP LLC | 0 | -100,00 | 0 | |||||
| 2026-02-12 | 13F | Jane Street Group, Llc | 160.411 | -48,93 | 373 | -63,54 | ||||
| 2026-02-12 | 13F | Jane Street Group, Llc | Put | 21.600 | 50 | |||||
| 2026-02-12 | 13F | Jane Street Group, Llc | Call | 22.700 | 62,14 | 53 | 15,56 | |||
| 2026-02-17 | 13F | Royal Bank Of Canada | 2.181 | 149,54 | 5 | 66,67 | ||||
| 2026-02-11 | 13F | Group One Trading, L.p. | 93.683 | -39,00 | 217 | -56,60 | ||||
| 2026-04-07 | 13F | Farther Finance Advisors, LLC | 15 | 0 | ||||||
| 2026-04-21 | 13F | SmartHarvest Portfolios, LLC | 14.947 | 29 | ||||||
| 2025-11-13 | 13F | Norges Bank | 0 | -100,00 | 0 | |||||
| 2026-02-17 | 13F | Russell Investments Group, Ltd. | 0 | -100,00 | 0 | |||||
| 2026-02-23 | 13F | Virtu Financial LLC | 11.588 | -50,37 | 0 | |||||
| 2026-02-13 | 13F | National Bank Of Canada /fi/ | 0 | -100,00 | 0 | |||||
| 2025-11-14 | 13F | Two Sigma Investments, Lp | 0 | -100,00 | 0 | |||||
| 2026-02-11 | 13F | Harvest Fund Management Co., Ltd | 0 | -100,00 | 0 | |||||
| 2026-02-17 | 13F | Jump Financial, LLC | 146.850 | -27,95 | 341 | -48,80 | ||||
| 2026-02-12 | 13F | Federation des caisses Desjardins du Quebec | 45.027 | 104 | ||||||
| 2025-11-14 | 13F | Walleye Capital LLC | Put | 0 | -100,00 | 0 | -100,00 | |||
| 2025-11-13 | 13F | Pinpoint Asset Management (Singapore) Pte. Ltd. | 0 | -100,00 | 0 | -100,00 | ||||
| 2026-01-29 | 13F | Vanguard Group Inc | 5.192.148 | 0,00 | 12.046 | -28,84 | ||||
| 2025-11-14 | 13F | Point72 Asia (Singapore) Pte. Ltd. | 0 | -100,00 | 0 | |||||
| 2025-11-14 | 13F | Cubist Systematic Strategies, LLC | 208.133 | -49,37 | 679 | -54,28 | ||||
| 2026-02-13 | 13F | Healthcare Of Ontario Pension Plan Trust Fund | 242.500 | -24,29 | 563 | -46,17 | ||||
| 2026-02-13 | 13F | Citigroup Inc | 432.486 | 9,34 | 1.003 | -22,19 | ||||
| 2026-02-17 | 13F | Ameriprise Financial Inc | 0 | -100,00 | 0 | |||||
| 2026-02-17 | 13F | D. E. Shaw & Co., Inc. | 821.154 | 45,43 | 1.905 | 3,53 | ||||
| 2026-02-17 | 13F | Citadel Advisors Llc | Put | 126.400 | 2,76 | 293 | -26,75 | |||
| 2026-02-17 | 13F | Citadel Advisors Llc | 868.095 | 172,08 | 2.014 | 93,56 | ||||
| 2026-03-06 | 13F | Hsbc Holdings Plc | 126.457 | 293 | ||||||
| 2026-02-13 | 13F | Verition Fund Management LLC | 0 | -100,00 | 0 | |||||
| 2026-02-13 | 13F | OMERS ADMINISTRATION Corp | 0 | -100,00 | 0 | |||||
| 2026-02-13 | 13F | State Street Corp | 418.306 | 6,38 | 970 | -24,28 | ||||
| 2026-02-13 | 13F | Caitong International Asset Management Co., Ltd | 0 | -100,00 | 0 | |||||
| 2026-02-17 | 13F | Advisor Group Holdings, Inc. | 100 | 0,00 | 0 | |||||
| 2026-02-13 | 13F | Arrowstreet Capital, Limited Partnership | 472.907 | -69,18 | 1.097 | -78,06 | ||||
| 2026-02-13 | 13F | Walleye Trading LLC | Put | 0 | -100,00 | 0 | ||||
| 2026-01-29 | 13F | UBS Group AG | 417.423 | -60,23 | 968 | -71,70 | ||||
| 2026-02-13 | 13F | Walleye Trading LLC | Call | 0 | -100,00 | 0 | ||||
| 2026-02-13 | 13F | Walleye Trading LLC | 0 | -100,00 | 0 | |||||
| 2026-02-10 | 13F | Goldman Sachs Group Inc | 914.816 | -8,82 | 2.122 | -35,11 | ||||
| 2026-02-17 | 13F | Two Sigma Advisers, Lp | 302.600 | 10,80 | 702 | -21,12 | ||||
| 2026-02-19 | 13F | Invesco Ltd. | 111.611 | -4,14 | 259 | -31,93 | ||||
| 2026-02-12 | 13F | California Public Employees Retirement System | 158.624 | -0,29 | 368 | -28,96 | ||||
| 2026-02-10 | 13F | Connor, Clark & Lunn Investment Management Ltd. | 538.715 | -6,94 | 1.250 | -33,81 | ||||
| 2026-02-17 | 13F | Tudor Investment Corp Et Al | Call | 115.300 | 267 | |||||
| 2026-02-17 | 13F | Bank Of America Corp /de/ | 4 | -100,00 | 0 | -100,00 | ||||
| 2026-02-06 | 13F | EverSource Wealth Advisors, LLC | 140 | -27,08 | 0 | |||||
| 2025-11-04 | 13F | IMC-Chicago, LLC | 0 | -100,00 | 0 | |||||
| 2026-02-10 | 13F | Commonwealth Of Pennsylvania Public School Empls Retrmt Sys | 131.307 | 0,00 | 305 | -28,97 | ||||
| 2026-02-12 | 13F | BlackRock, Inc. | 685.338 | 77.867,92 | 1.590 | 79.350,00 | ||||
| 2026-02-17 | 13F | Citadel Advisors Llc | Call | 59.500 | 14,20 | 138 | -18,34 | |||
| 2026-02-13 | 13F | Squarepoint Ops LLC | 24.536 | -18,04 | 57 | -42,27 | ||||
| 2026-02-12 | 13F | Renaissance Technologies Llc | 2.280.278 | -5,45 | 5.290 | -32,71 | ||||
| 2026-02-13 | 13F | Barclays Plc | 9.566 | -86,90 | 22 | -92,31 | ||||
| 2026-02-18 | 13F | GWM Advisors LLC | 1.309 | 0,00 | 3 | -25,00 | ||||
| 2026-02-17 | 13F | Susquehanna International Group, Llp | Call | 252.500 | -24,76 | 586 | -46,53 | |||
| 2026-02-17 | 13F | Susquehanna International Group, Llp | 132.949 | 308 | ||||||
| 2026-02-17 | 13F | Susquehanna International Group, Llp | Put | 82.000 | -43,41 | 190 | -59,75 | |||
| 2026-02-10 | 13F | Bnp Paribas Arbitrage, Sa | 262.555 | 100,52 | 609 | 42,96 | ||||
| 2026-02-06 | 13F | Gsa Capital Partners Llp | 131.108 | 16,83 | 0 | |||||
| 2026-01-29 | 13F | Cornerstone Investment Partners, LLC | 0 | -100,00 | 0 | |||||
| 2026-02-13 | 13F | Centiva Capital, LP | 0 | -100,00 | 0 | |||||
| 2026-02-17 | 13F | Tower Research Capital LLC (TRC) | 25.726 | 194,82 | 60 | 110,71 | ||||
| 2026-02-12 | 13F | Hrt Financial Lp | 22.020 | 86,63 | 0 | |||||
| 2026-02-11 | 13F | Jpmorgan Chase & Co | 165.015 | 13,47 | 383 | -19,41 | ||||
| 2026-02-17 | 13F | Quadrature Capital Ltd | 39.454 | 92 | ||||||
| 2026-02-17 | 13F | Public Employees Retirement System Of Ohio | 75.834 | -70,31 | 176 | -78,97 | ||||
| 2026-04-02 | 13F | Marex Group plc | 0 | -100,00 | 0 | -100,00 | ||||
| 2026-02-10 | 13F | Nomura Asset Management Co Ltd | 0 | 0 | ||||||
| 2025-11-14 | 13F | Wolverine Trading, Llc | Put | 0 | -100,00 | 0 | ||||
| 2025-11-14 | 13F | Wolverine Trading, Llc | Call | 0 | -100,00 | 0 | ||||
| 2026-02-17 | 13F | Point72 Asset Management, L.P. | 112.888 | -43,01 | 262 | -59,53 | ||||
| 2026-02-13 | 13F | Morgan Stanley | 1.469.385 | -25,39 | 3.409 | -46,91 | ||||
| 2026-02-13 | 13F | Carmignac Gestion | 440.947 | 0,00 | 1.023 | -28,88 | ||||
| 2026-02-13 | 13F | American Century Companies Inc | 69.192 | 0,18 | 161 | -28,89 | ||||
| 2026-02-17 | 13F | Millennium Management Llc | 178.957 | 42,12 | 415 | 1,22 | ||||
| 2026-02-13 | 13F | Walleye Capital LLC | 89.708 | -80,57 | 208 | -86,17 | ||||
| 2025-11-03 | 13F | Mirae Asset Global Investments Co., Ltd. | 0 | -100,00 | 0 | |||||
| 2026-02-12 | 13F | SWAN Capital LLC | 32 | 0,00 | 0 | |||||
| 2026-01-21 | 13F | Prime Capital Investment Advisors, LLC | 10.000 | 0,00 | 23 | -28,12 | ||||
| 2026-04-28 | 13F | SBI Securities Co., Ltd. | 1.121 | 0,00 | 2 | 0,00 | ||||
| 2026-02-11 | 13F | Simplex Trading, Llc | 3.475 | -96,61 | 8 | |||||
| 2026-02-13 | 13F | Sei Investments Co | 79.619 | -35,04 | 185 | -53,88 | ||||
| 2026-02-17 | 13F | XTX Topco Ltd | 213.813 | 296,07 | 496 | 183,43 | ||||
| 2026-01-30 | 13F | Us Bancorp \de\ | 0 | -100,00 | 0 | |||||
| 2026-02-17 | 13F | Susquehanna Portfolio Strategies, LLC | 72.909 | 169 | ||||||
| 2026-02-13 | 13F | Rhumbline Advisers | 6.876 | -7,21 | 16 | -37,50 | ||||
| 2026-02-13 | 13F | Marshall Wace, Llp | 99.830 | 232 | ||||||
| 2026-02-17 | 13F | Two Sigma Securities, Llc | 16.101 | -47,74 | 37 | -63,00 | ||||
| 2026-02-17 | 13F | Jones Financial Companies Lllp | 60 | 0 | ||||||
| 2026-04-07 | 13F | Signaturefd, Llc | 110 | 0,00 | 0 | |||||
| 2026-02-17 | 13F | Capital Fund Management S.a. | 102.070 | -18,08 | 237 | -41,87 | ||||
| 2025-11-12 | 13F | Headlands Technologies LLC | 0 | -100,00 | 0 | |||||
| 2026-03-11 | 13F | Leonteq Securities AG | 0 | -100,00 | 0 | |||||
| 2026-02-13 | 13F | Gmt Capital Corp | 177.900 | 0,00 | 413 | -28,84 | ||||
| 2026-02-10 | 13F | Acadian Asset Management Llc | 1.060.924 | -18,94 | 2 | -50,00 |